Background
What is Dutch Bros?
Dutch Bros is a well-known coffee chain that was started in Grants Pass, Oregon, by Dane and Travis Boersma. Originating from a single pushcart, the company has spread across the Northwest and beyond, with 950 locations and counting. They are now committed to serving a wide range of customers to make “every visit feel like a celebration,” with a diverse selection of coffee beverages.
Problem
High Rates of Error and User Confusion with Site Navigation
The current Dutch Bros website has several critical usability flaws and lacks standard e-commerce features, resulting in high user error rates and a significant breakdown in the user flow for key conversion tasks.
Research
Research Process
Our project aimed to identify issues and collect both qualitative and quantitative data that supported our initial heuristic evaluation results. We structured our process to move from predicting failure points to validating them with measurable data.
Usability Test Methodology
1. User Research and User Personas
Survey of demographic questions to random participants to form personas that identify the typical user of the site.
2. Heuristic Evaluations
Using the Jakob Nielsen method, rating the severity of different usability issues found on the site.
3. Pre-Test Questionnaire
Demographic and internet experience related questions to determine the type of user we were conducting the test on.
4. Scenarios and Tasks
Three scenarios and two tasks each to test the users on different issues we found with the site, measuring time on task, error counts, success rate, and observing movements and thoughts.
5. Post-Test Questionnaire
Gathering participants thoughts and feelings of the test and overall website.
Heuristic Evaluation and Scenario Design
To initiate this project, we conducted a Heuristic Evaluation to identify key areas to target in our anonymous user testing. We found significant issues in Consistency and Standards and the Efficiency of Use. We used these predicted pain points to develop three high-stakes scenarios for testing, measuring time till completion, error rates (wrong navigation choices), and key user quotes.
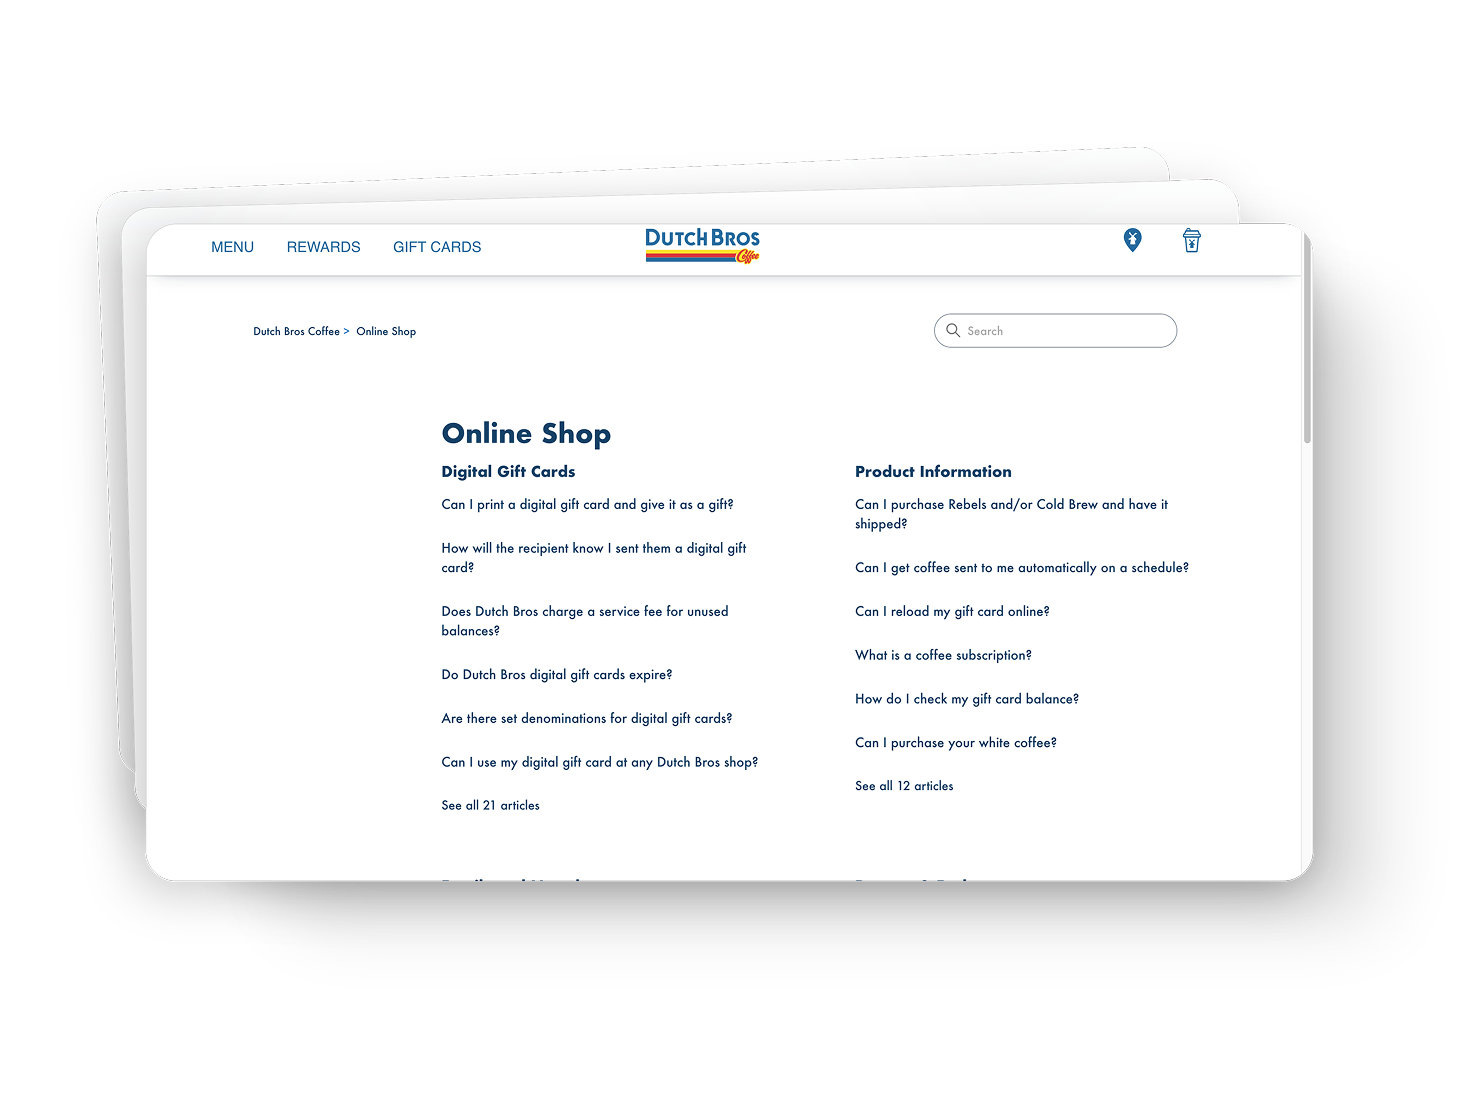
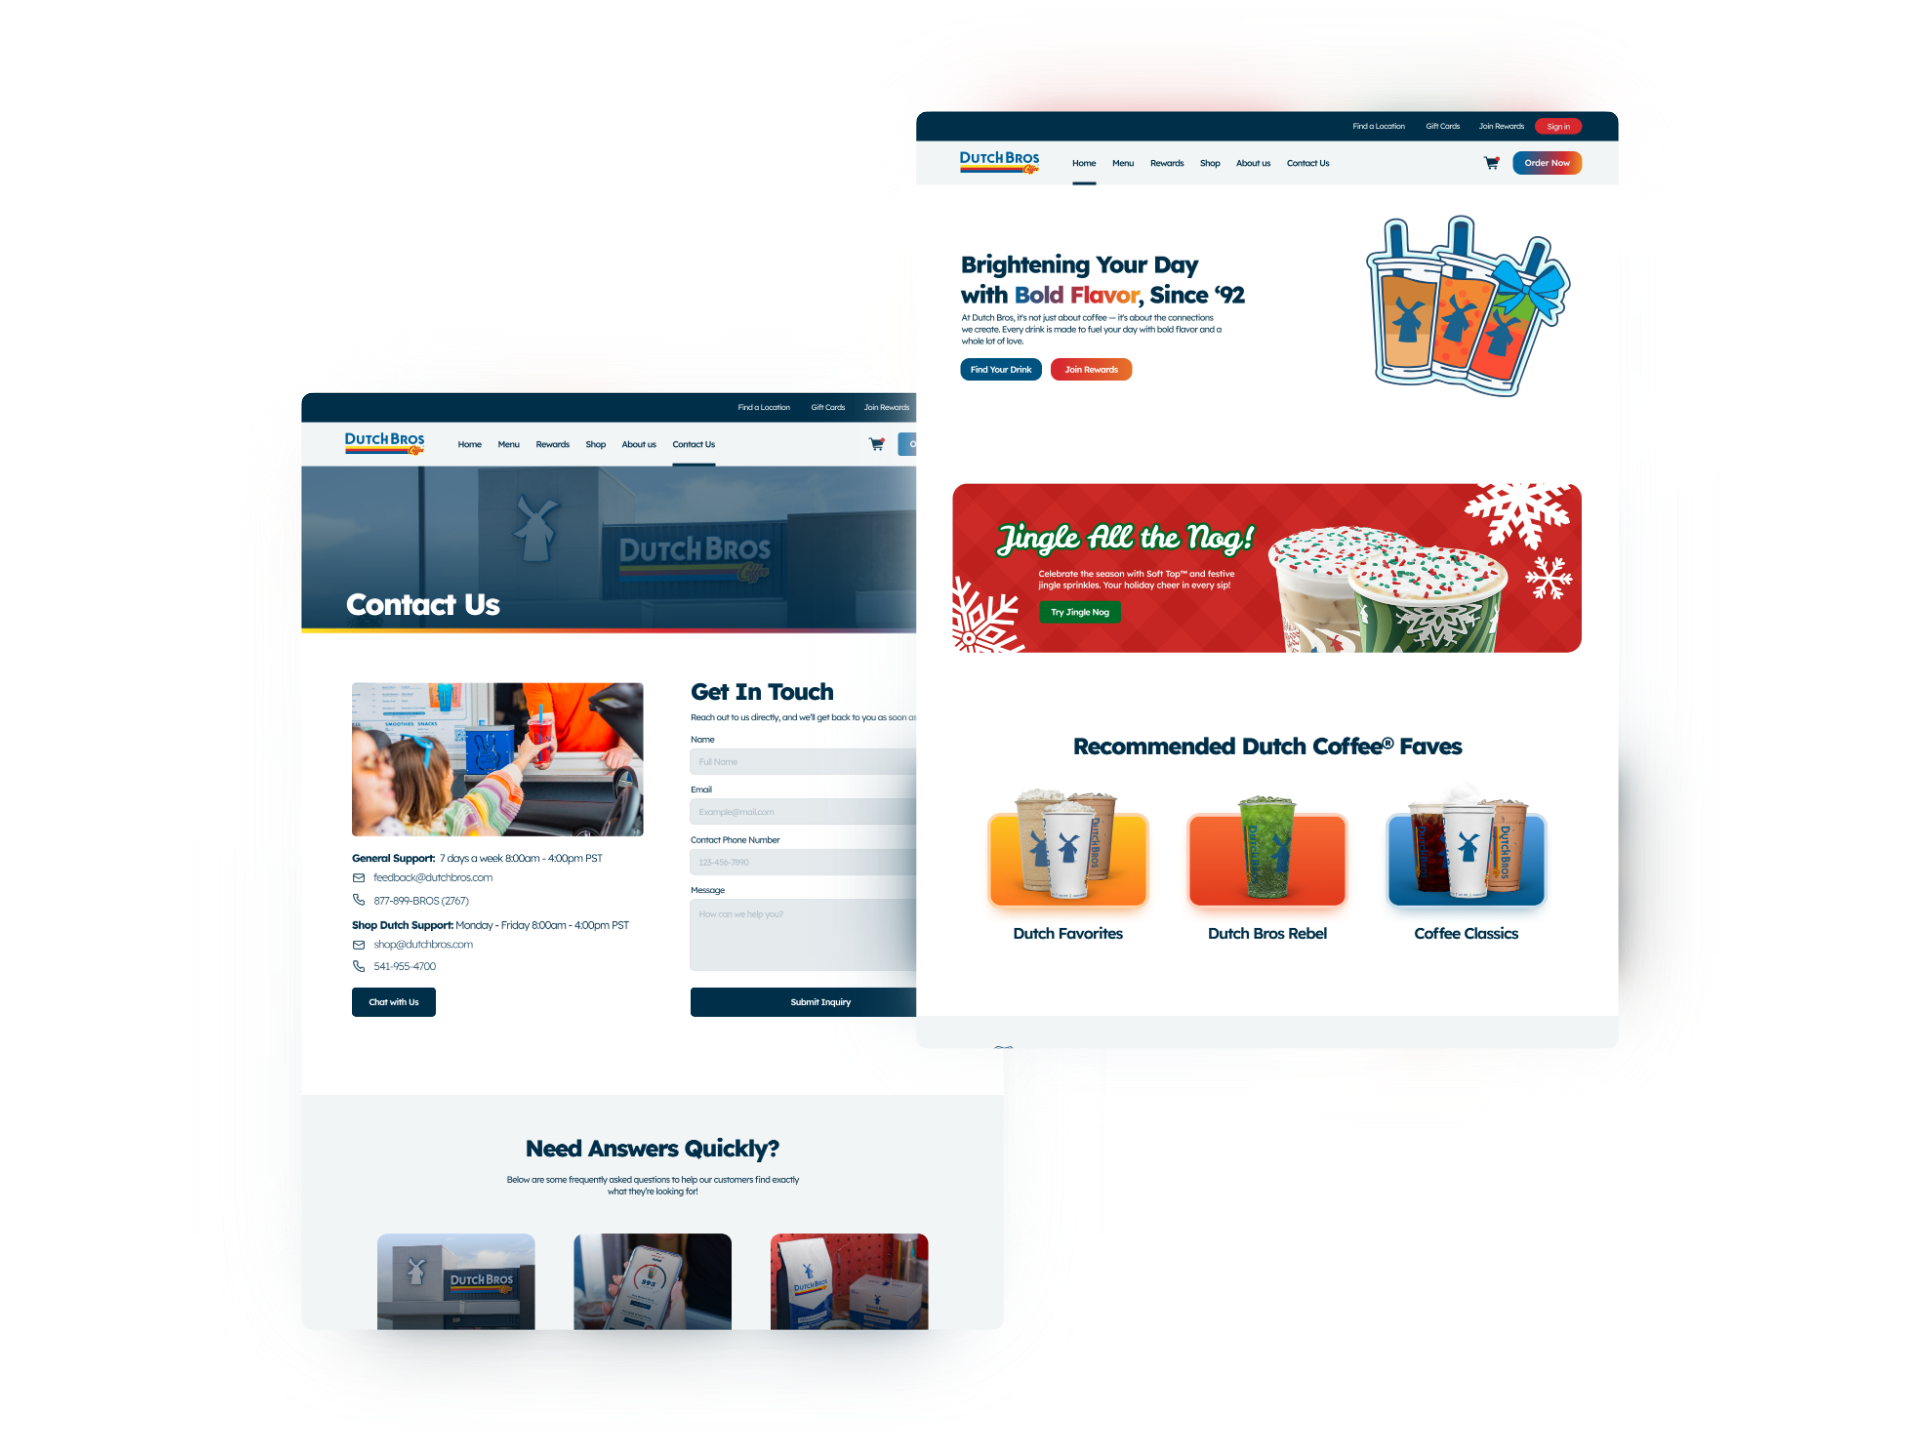
Scenario 1: Shipping Inquiry
You ordered a bag of whole bean coffee but you can’t figure out how long it will take to be shipped. You need to locate information about how long it will take to receive your coffee order.
Task 1
Find the FAQ/Help section of the site to find information about shipping.
Task 2
Find an email to contact Dutch Bros. customer support about your package.
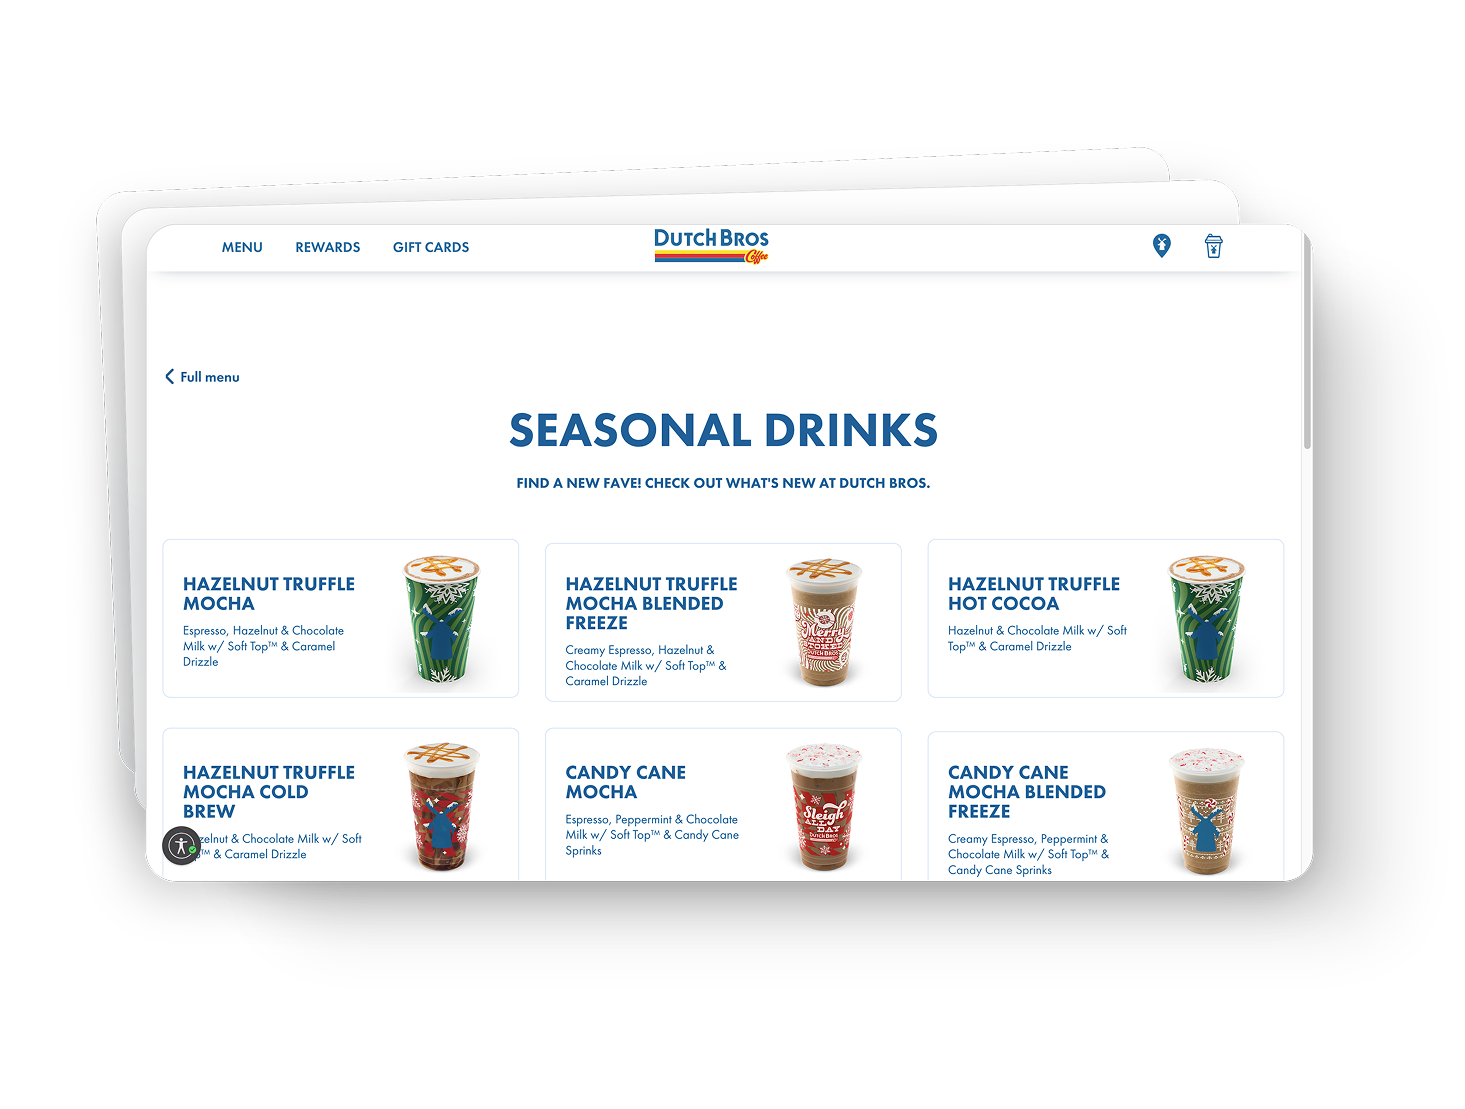
Scenario 2:
You are a health-conscious coffee drinker who is interested in the new seasonal drinks. Before you go to your local Dutch Bros, you'd like to visit the menu to check which seasonal options are available and find details about the new flavors.
Task 1
Locate the menu on the Dutch Bros website and locate the seasonal drink options.
Task 2
Find a way to review the nutritional information for seasonal drinks.
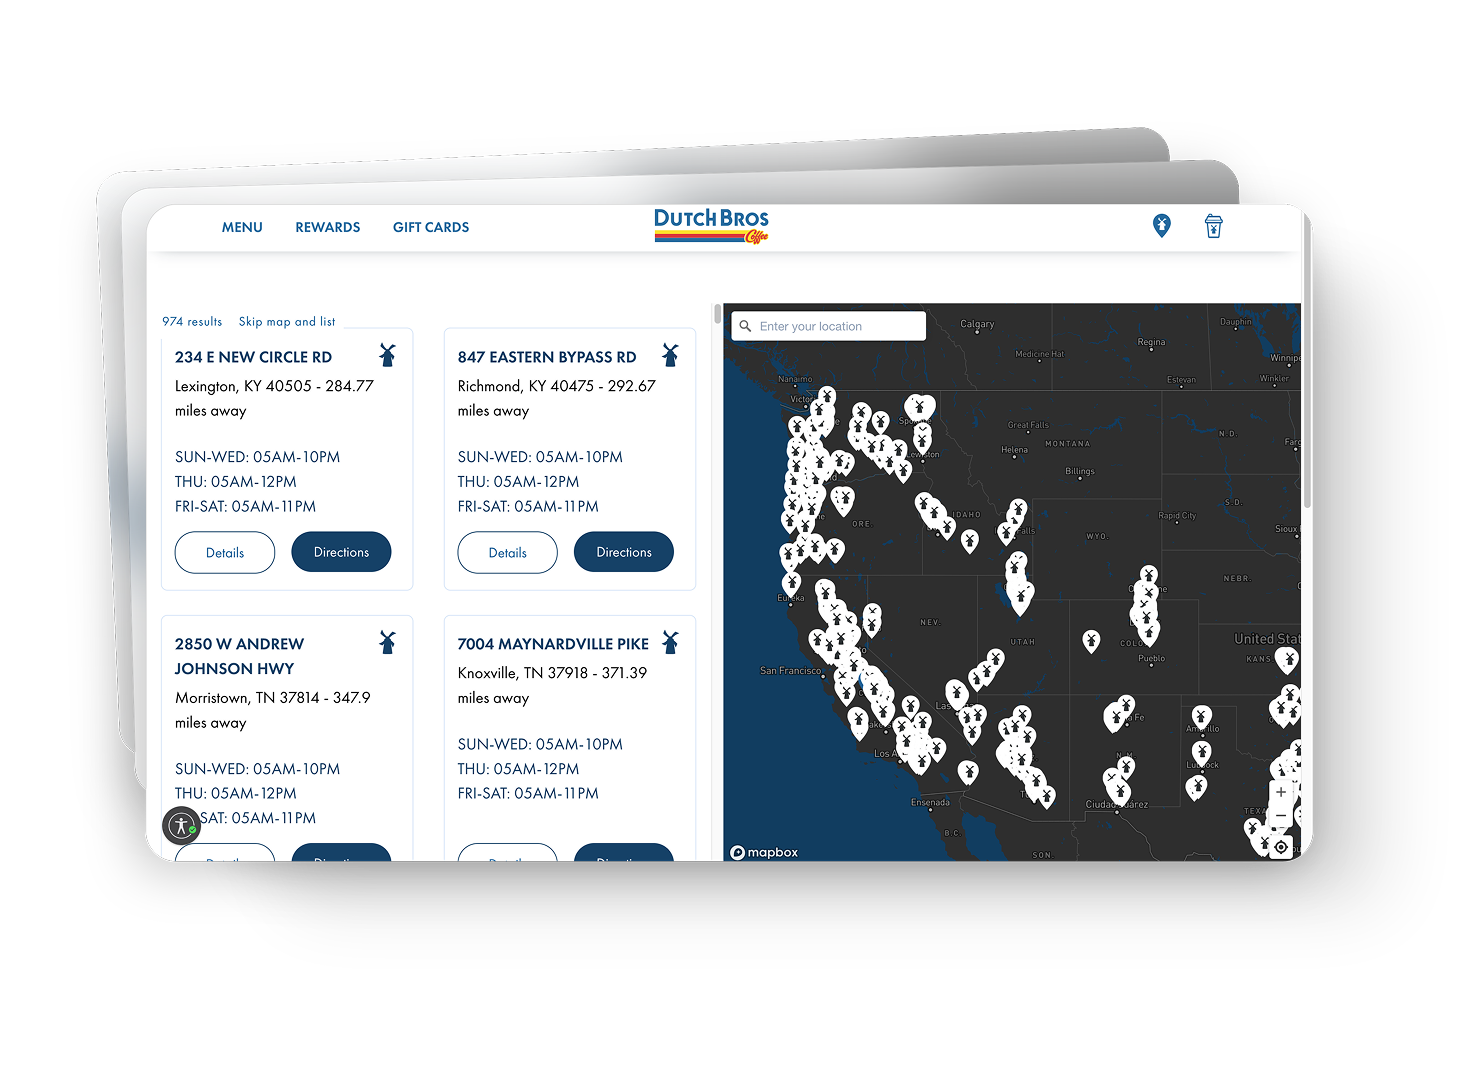
Scenario 3:
You have an 8 a.m. meeting with a physician’s practice. You won't have time to wait in line behind the morning rush of coffee-goers so you decide to order online for an early pick up. While finishing up a project on your laptop you open a new tab and go to the Dutch Bros website to place your order.
Task 1
Find out how to place a mobile order for Dutch Bros. Coffee.
Task 2
Search for and find the nearest Dutch Bros location to your current area.
Testing
Qualitative Insights
After testing, we were able to pinpoint several critical pain points that explained the low success rates, showcasing our thinking about where the user journey failed:
- Lack of Online Ordering and Rewards: The absence of features considered standard for a modern coffee chain was the biggest source of frustration.
- Quote:"At that point I would just find a different coffee shop to order from. You should be able to order on the website." (Scenario 3, Task 1)
- Quote:"At that point I would just find a different coffee shop to order from. You should be able to order on the website." (Scenario 3, Task 1)
- Site Difficult to Navigate: Users expressed frustration with the lack of expected navigation tools (like a persistent search bar) and the non-intuitive organization of links.
- Observation: Participant seemed extremely confused and, at some points, panicked, clicking with little purpose in an attempt to find an answer.
- Poor Content Structure: Important information was often buried, misplaced, or spread across multiple pages (e.g., contact details hidden in random articles).
- Quote: "It's not clear, it's under a bunch of different stuff, why not just put it under contact us?" (Scenario 1, Task 2)
- Poor Visual Design: Participants noted issues related to overly bright colors and inconsistent screen layouts, causing discomfort and distraction.
- Quote: "The colors were awfully bright and distracting." (Scenario 3, Task 1)
Results
Test Results
- Shipping Inquiry
- The task was to find the Support Email. The Success Rate was 55.56%. This took an Average Time of 2 minutes, 42.56 seconds, and resulted in an Average Error Count of 2.4.
- Mobile Ordering
- The task was to find the Mobile Order Method. The Success Rate was 55.56%. This task had an Average Time of 1 minute, 54.46 seconds, and an Average Error Count of 4.0.
- Menu & Nutrition
- The task was to Locate Menu/Seasonal items. This achieved a 100% Success Rate, with a very fast Average Time of 7.36 seconds, and an Average Error Count of 0.29.
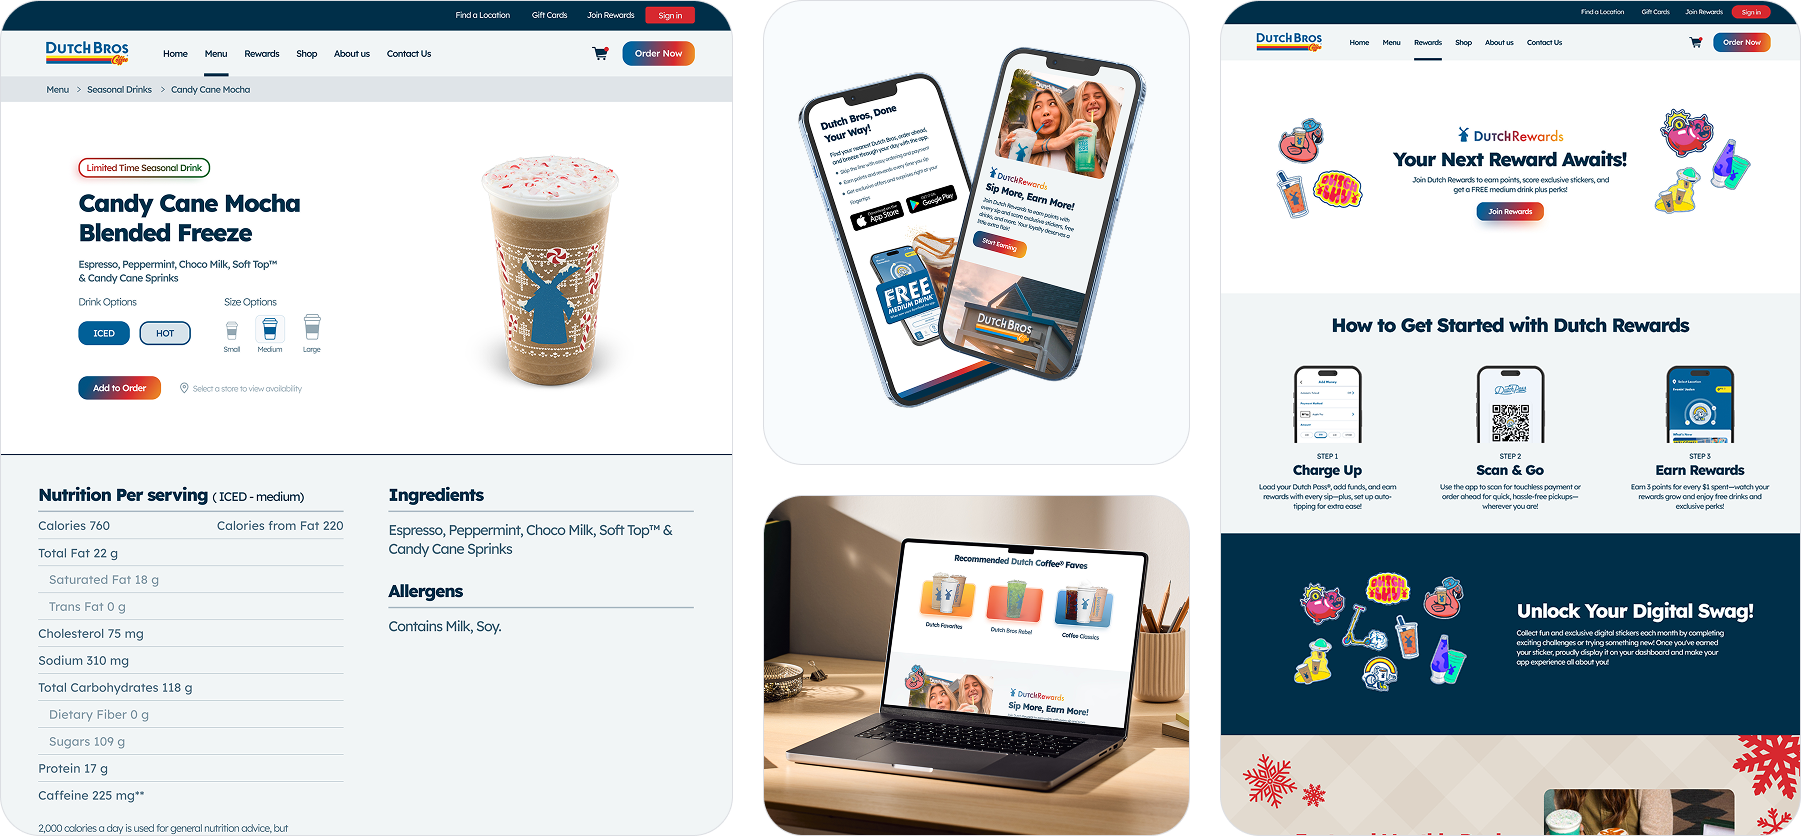
Final Design
Key Recommendations
Our recommendations were designed to directly address the qualitative friction and quantitative failure points, aiming to align the site with modern user expectations and improve task efficiency.
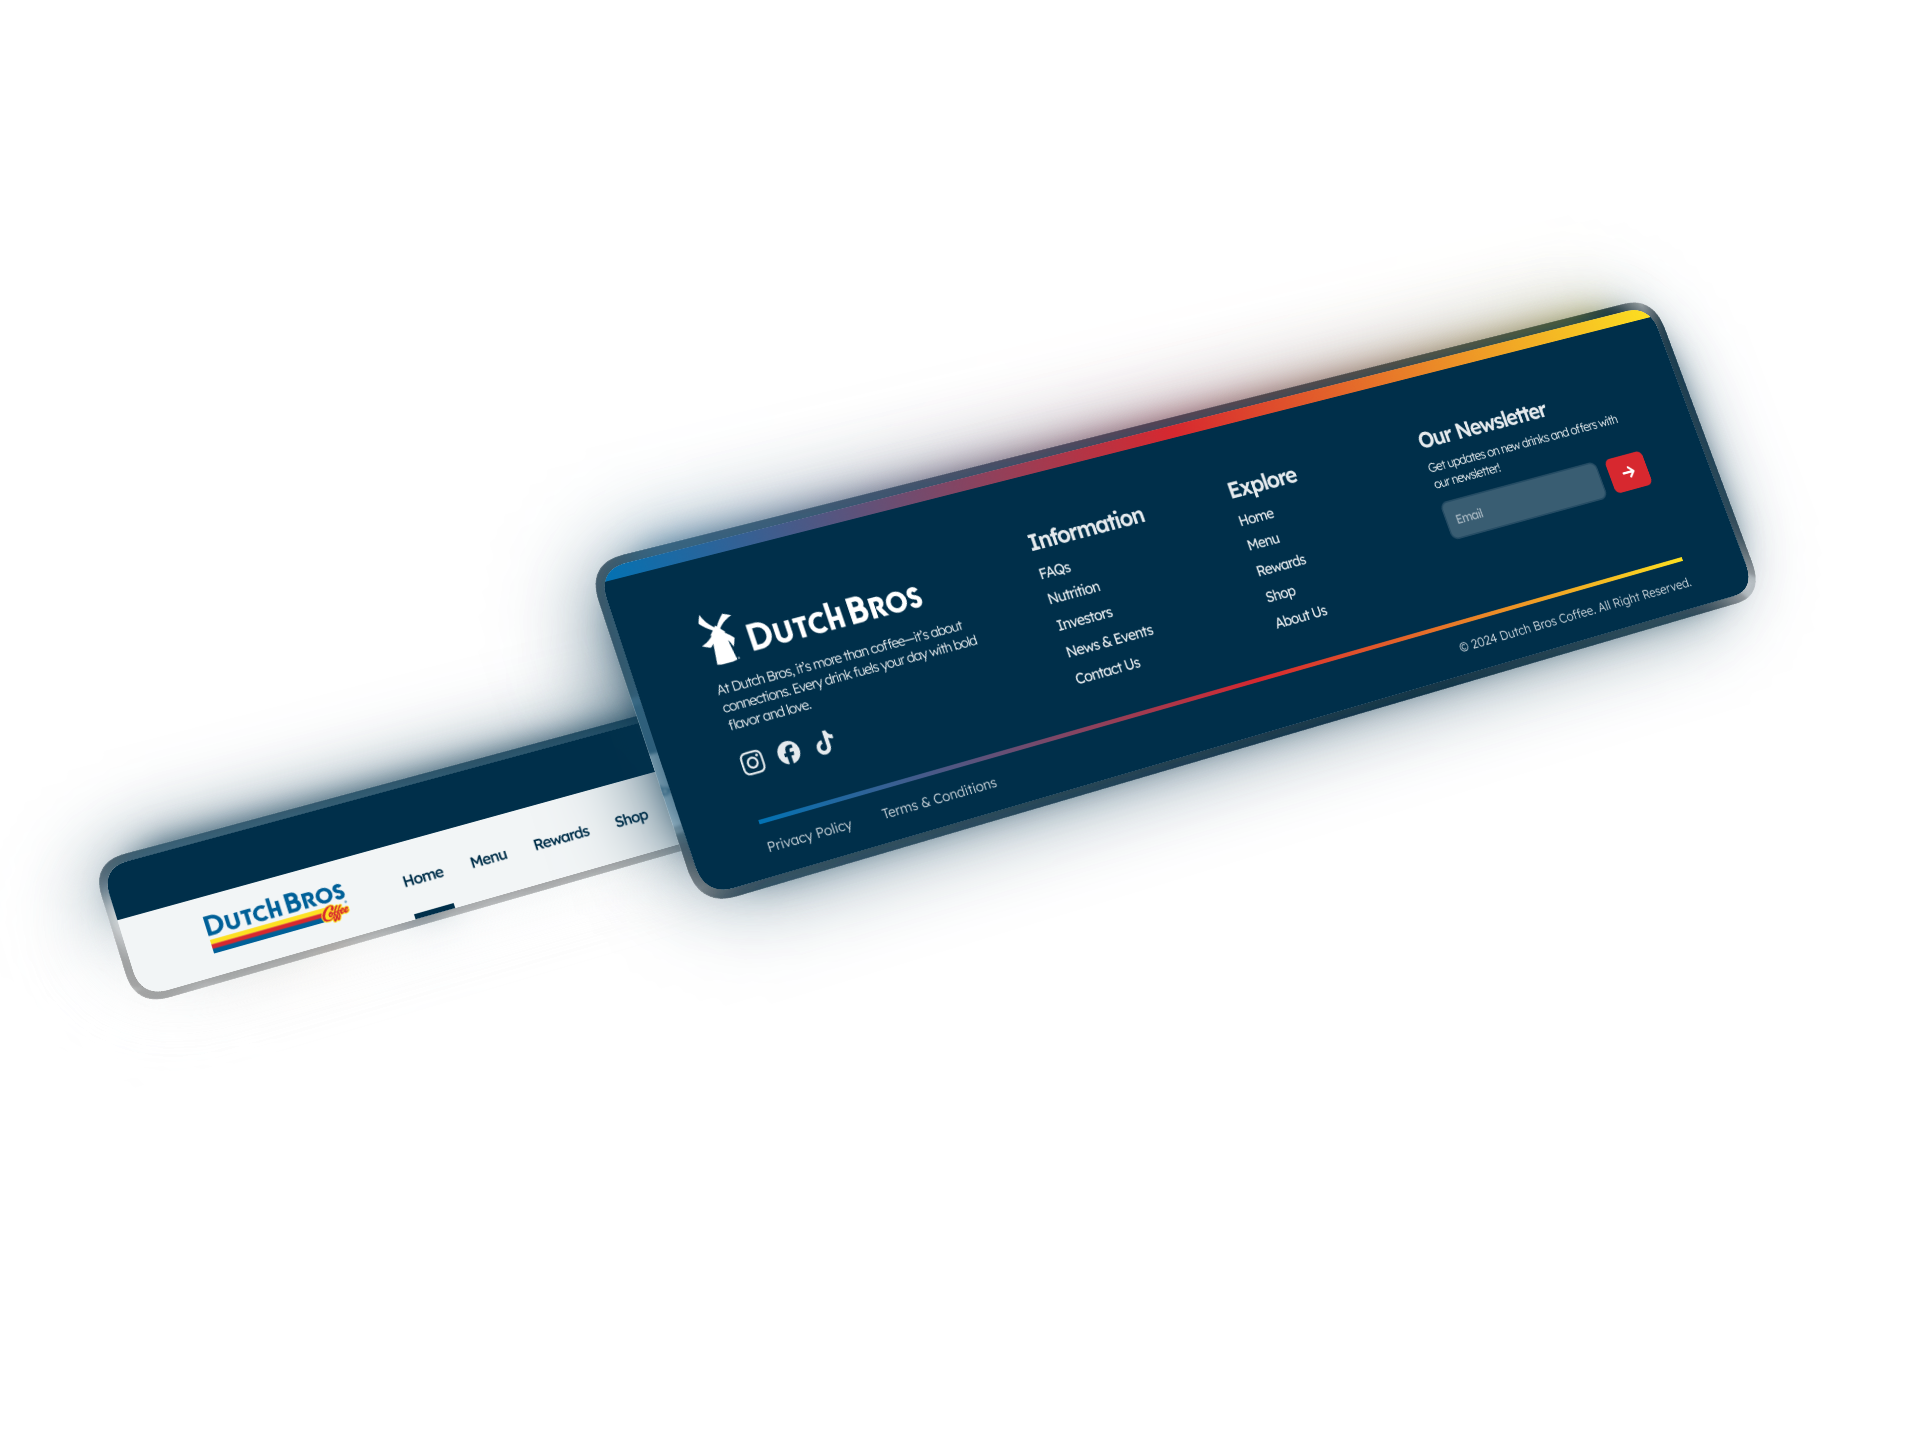
🧭Enhance Navigation
Improve website navigation by adding more tabs, a search bar, intuitive dropdown menus, and descriptive link titles to enhance usability.
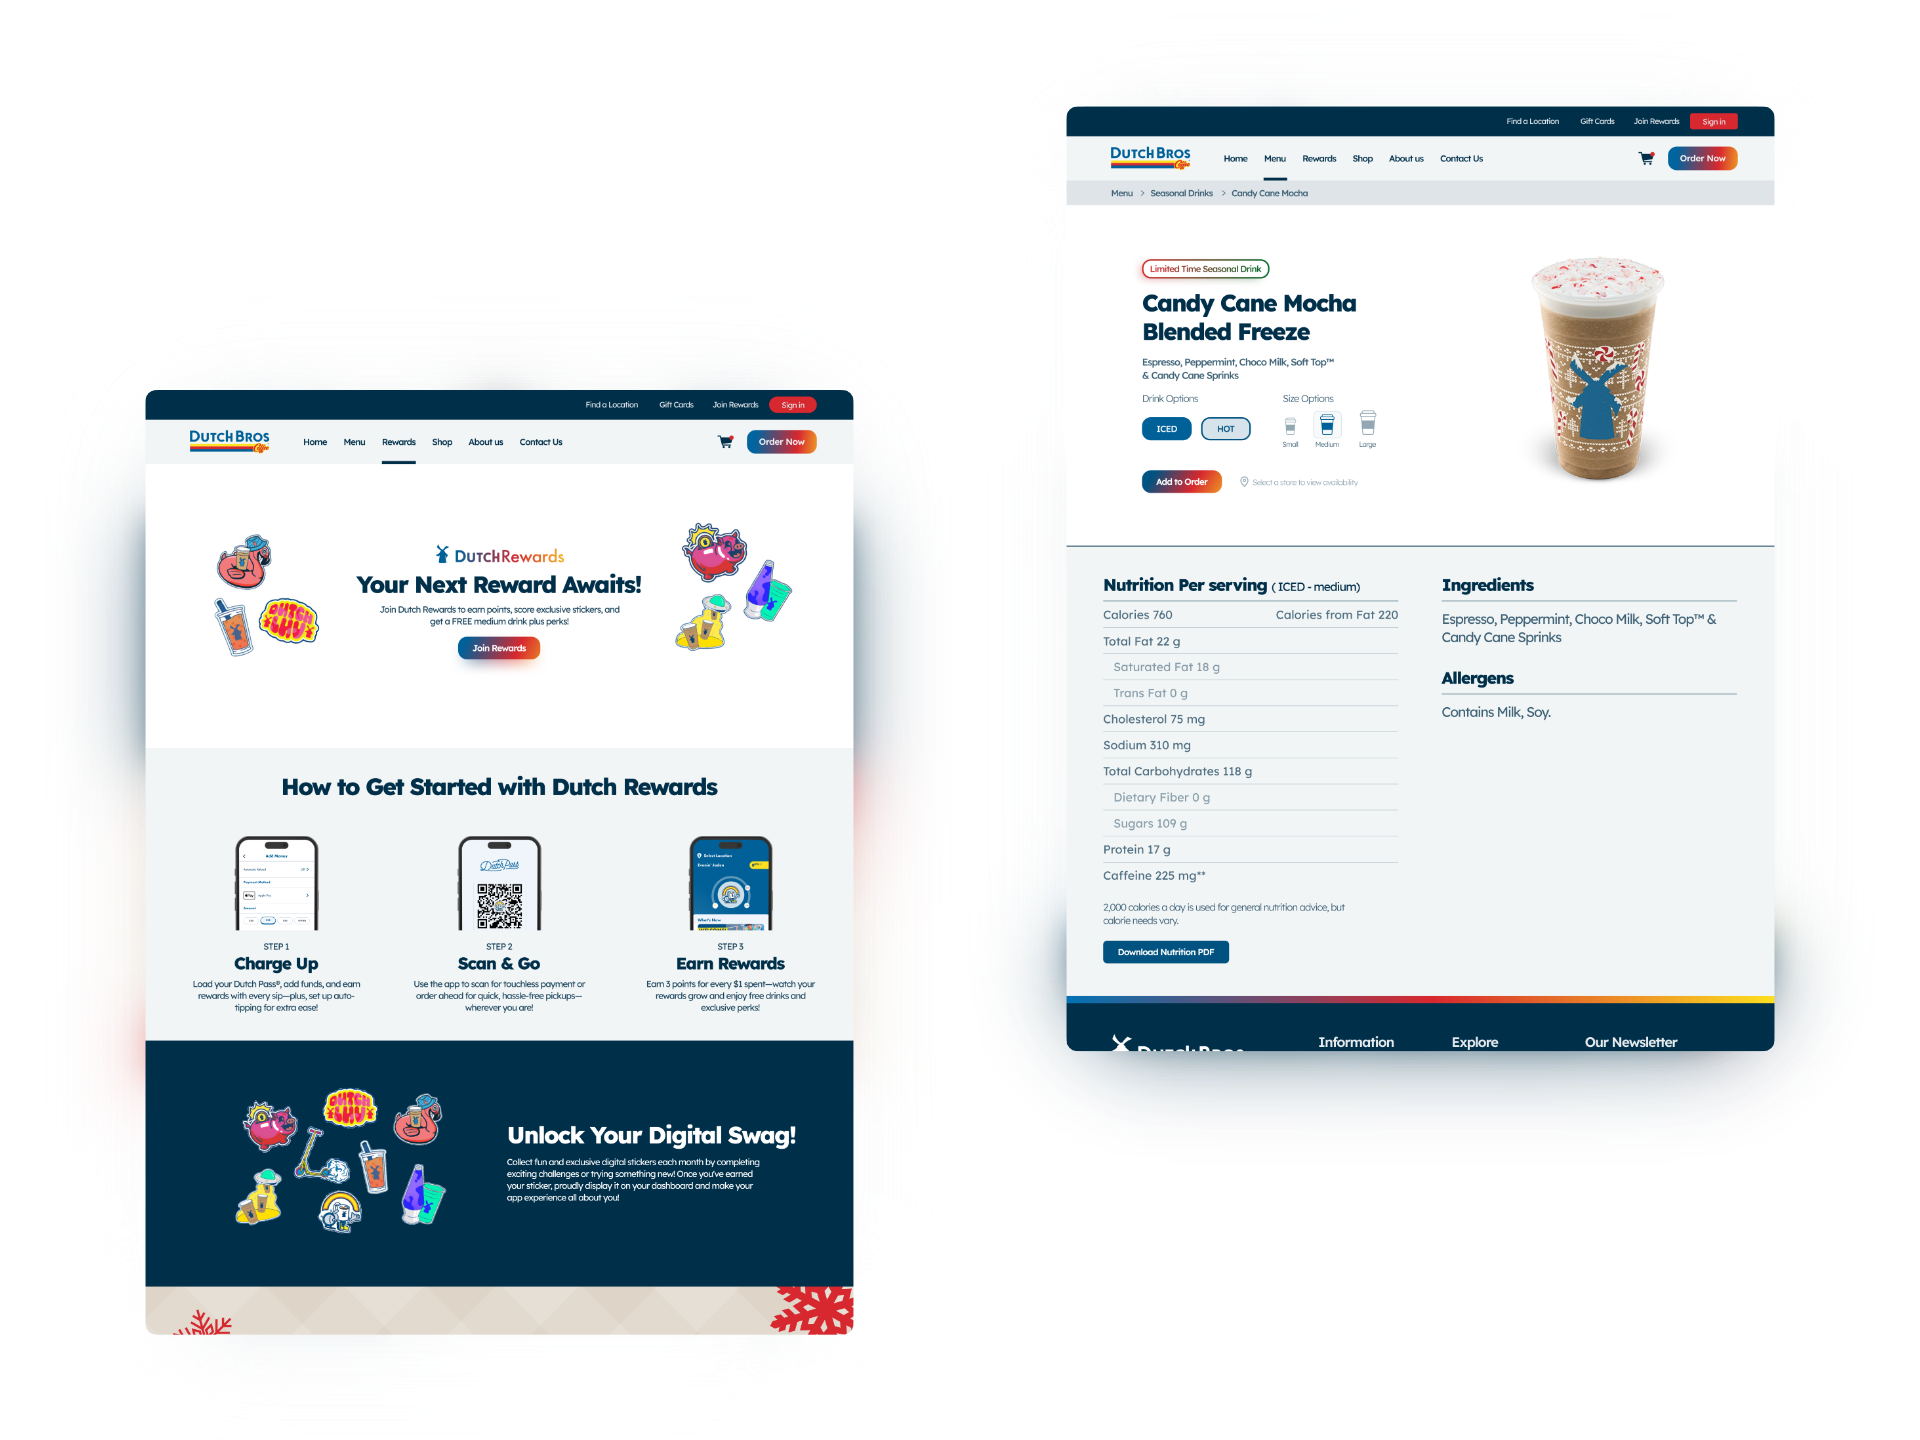
🔑Add Key Features
Add missing key features like online ordering, rewards access linked to the app, and integrate the online shop into the main site.
🌐Improve Visual Design
Enhance visual design with consistent fonts, better color contrast, organized layouts, improved spacing, and reduce unnecessary content.
Reflection
Measurable Recommendations for Enhanced Website Efficiency
This analysis led to actionable insights to help improve the Dutch Bros Website and make measurable recommendations. Some of these improvements consisted of visual hierarchy, rewards functionality, and simplifications of clear navigation. If these changes were implemented, it would be expected to improve customer retention and conversion efficiency.
Implementation Plan & Next Steps
- Initial Implementation: Begin implementing improvements using a prototype to showcase key features.
- Key Prototype Focus Areas: The prototype will demonstrate refinements to:
- Online ordering functionality
- The site's visual design
- Overall page structure
- Enhancements to site navigation
- Validation: Conduct further user testing on the prototype to ensure the effectiveness of the changes.
- Data-Driven Iteration: Make any necessary adjustments based on the results of the user feedback and testing data.